Getting Started
Overview
This library deals with the following concepts:
- Report
- A class that maintains a collection of charts
- Chart
- A class that, given a set of options and a set of data, generates HTML to display that data in a nice format. Charts can include graphs, tables, and other arbitrary visualization types.
- ChartData
- A class that allows the collection of data in a structured format, which can then be passed into a Chart.
- ChartRenderer
- A class that implements the rendering of Chart objects. Changing the ChartRenderer class for a Report or Chart allows for easy changing of rendering technologies - i.e. google charts, FusionCharts, HighCharts etc.
- ReportView
- A class-based view to assist with the creation of a report API. More information in the API documentation.
Report objects
Consider the following, very simple report - this would usually be located in a
reports.py file in your app directory:
# myapp/reports.py
from report_tools.reports import Report
from report_tools.chart_data import ChartData
from report_tools.renderers.googlecharts import GoogleChartsRenderer
from report_tools import charts
class MyReport(Report):
renderer = GoogleChartsRenderer
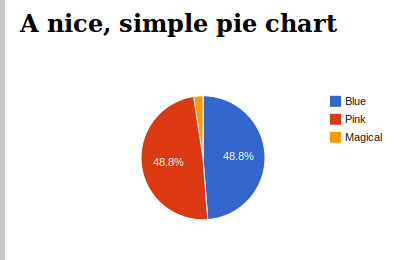
pie_chart = charts.PieChart(
title="A nice, simple pie chart",
width=400,
height=300
)
def get_data_for_pie_chart(self):
data = ChartData()
data.add_column("Pony Type")
data.add_column("Population")
data.add_row(["Blue", 20])
data.add_row(["Pink", 20])
data.add_row(["Magical", 1])
return data
A Report is composed of Chart objects. In this case, the report has a single
chart pie_chart. This chart has been given a title, width and height, but other than
that it will use the default rendering options.
For information on the available Chart classes, see the Chart documentation.
Rendering for this report will be performed by the GoogleChartsRenderer class,
which uses Google’s visualization framework. For more information on the available
rendering classes, see the renderer documentation.
All charts on a report require a get_data_for_xxx method, where xxx is the
attribute name given to the chart. In this case, you can see the get_data_for_pie_chart
field has been created. Pie charts require a ChartData object as input, so
the get_data_for_pie_chart method creates one, fills it with data and returns it.
For detailed information on how to enter data into a ChartData object or other
data storage formats, see the ChartData documentation.
Using a report in your views
Using a report in your view is simple:
# myapp/views.py

from django.shortcuts import render
from myapp.reports import MyReport


def my_report(request):
    # Initialise the report
    template = "myapp/my_report.html"
    report = MyReport()
    context = {'report': report}

    return render(request, template, context)
You can also use the included class based view, which will help if you wish to use API features down the track:
# myapp/views.py

from django.shortcuts import render
from myapp.reports import MyReport
from report_tools.views import ReportView


class MyReportView(ReportView):
    def get_report(self, request):
        return MyReport()

    def get(self, request):
        template = 'myapp/my_report.html'
        context = {
            'report': self.get_report(request),
        }

        return render(request, template, context)
Note the use of the get_report method. This provides the hook required for the API
to grab the report. For more information, check the API documentation.
Using a report in your templates
Using a report in your template is also straightforward
<!-- templates/myapp/my_report.html -->

<h1 class="chart-header">{{ report.pie_chart.title }}</h1>

<div class="chart-container">
	{{ report.pie_chart }}
</div>